ggplot2: Plotting Dates, Hours and Minutes
Plotting timeseries with dates on x-axis and times on y-axis can be a bit tricky in ggplot2. However, with a little trick this problem can be easily overcome.
Let’s assume that I wanted to plot when the sun rises in London in 2010.
sunriset function in maptools package calculates the sunrise times using algorithms provided by the National Oceanic & Atmospheric Administration (NOAA). I need to input the location details in a matrix format and specify for which dates I require the sunrise times.
> library(maptools) |
> x_seq <- seq(from = as.POSIXct("2010-01-01", tz = "GMT"),
+     length.out = 365, by = "days")
> coord <- matrix(c(-0.13, 51.5), nrow = 1)
|
> sunrise <- sunriset(coord, x_seq, direction = "sunrise", + POSIXct.out = TRUE) > head(sunrise, 3) day_frac time 1 0.3376285 2010-01-01 08:06:11 2 0.3375441 2010-01-02 08:06:03 3 0.3374209 2010-01-03 08:05:53 |
The time variable now includes information about both the date and time of sunrise in class POSIXct.
I would like to plot date on x-axis and time on y-axis, thus the time element needs to be extracted first. However, as the times must be in POSIXct (only times of class POSIXct are supported in ggplot2), a two-step conversion is needed.
First the time is converted to a character vector, effectively stripping all the date information. The time is then converted back to POSIXct with today’s date – the date is of no interest to us, only the hours-minutes-seconds are.
> sunrise$hms <- format(sunrise$time, format = "%H:%M:%S") > sunrise$hms <- as.POSIXct(sunrise$hms, format = "%H:%M:%S") > head(sunrise, 3) day_frac time hms 1 0.3376285 2010-01-01 08:06:11 2010-01-20 08:06:11 2 0.3375441 2010-01-02 08:06:03 2010-01-20 08:06:03 3 0.3374209 2010-01-03 08:05:53 2010-01-20 08:05:53 |
Now everything is set for plotting.
> library(ggplot2) |
> ggplot(sunrise, aes(time, hms)) + geom_line() |
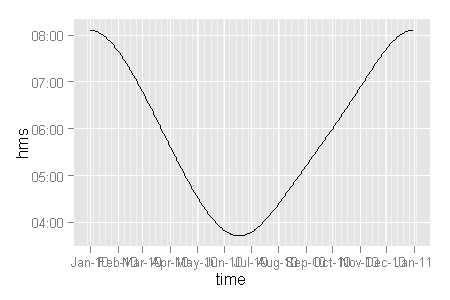
The default x-axis labels could be made somewhat clearer:
> last_plot() + scale_x_datetime("", format = "%b") +
+     ylab("")
|


Hi Learnr – I just saw this http://junkcharts.typepad.com/junk_charts/2010/02/cousin-misfit.html and thought you might be the one to recreate this in ggplot2?
As always – thanks for a great blog
Carlitos has posted code to create this plot in ggplot2 in the comments of this blogpost.
I would add ‘opts(axis.text.x=theme_text(angle=60, hjust=1.2 ))’ to the first chart, to plot the labels diagonally so they are easier to read.
Thank you this has been incredibly helpful:
last_plot() + scale_x_datetime("", format = "%b")Does anyone knows how to plot the graph with multiple labels including time, date and year? The plot should look like it is shown here: http://imgur.com/ZTNPniA
Thank you for any assistance.
Thank you so much!!!
I was really struggling with plotting time-series data, but your posting was amazingly helpful!