ggplot2 Version of Figures in “Lattice: Multivariate Data Visualization with R” (Part 7)
July 27, 2009
This is the 7th post in a series attempting to recreate the figures in Lattice: Multivariate Data Visualization with R (R code available here) with ggplot2.
Previous parts in this series: Part 1, Part 2, Part 3, Part 4, Part 5, Part 6.
Chapter 7 – Graphical Parameters and Other Settings
Topics covered:
- The graphical parameter system
- Themes, devices
- Initializing graphics devices
- Querying and modifying parameters
- Available parameters
- Non-graphical options
- Making customizations persistent
Figure 7.1
> library(lattice) > library(ggplot2) |
lattice
> pl <- dotplot(reorder(Var2, Freq) ~ Freq | Var1, data = as.data.frame.table(VADeaths),
+     origin = 0, type = c("p", "h"), main = "Death Rates in Virginia - 1940",
+     xlab = "Number of deaths per 100")
> print(pl)
|
ggplot2
> pg <- ggplot(as.data.frame.table(VADeaths), aes(reorder(Var2,
+     Freq), Freq)) + geom_point() + geom_linerange(aes(ymin = 0,
+     ymax = Freq)) + facet_grid(~Var1) + ylab("Number of deaths per 100") +
+     xlab("") + opts(title = "Death Rates in Virginia - 1940") +
+     coord_flip()
> print(pg)
|
Figure 7.2
lattice
> dot.line.settings <- trellis.par.get("dot.line")
> dot.line.settings$col <- "transparent"
> trellis.par.set("dot.line", dot.line.settings)
> plot.line.settings <- trellis.par.get("plot.line")
> plot.line.settings$lwd <- 2
> trellis.par.set("plot.line", plot.line.settings)
> print(trellis.last.object())
|
ggplot2
> pg <- pg + geom_linerange(aes(ymin = 0, ymax = Freq), + size = 1.5) + opts(panel.grid.major = theme_blank(), + panel.grid.minor = theme_blank()) > print(pg) |
Figure 7.3
> tp <- trellis.par.get()
> unusual <- c("grid.pars", "fontsize", "clip", "axis.components",
+     "layout.heights", "layout.widths")
> for (u in unusual) tp[[u]] <- NULL
> names.tp <- lapply(tp, names)
> unames <- sort(unique(unlist(names.tp)))
> ans <- matrix(0, nrow = length(names.tp), ncol = length(unames))
> rownames(ans) <- names(names.tp)
> colnames(ans) <- unames
> for (i in seq(along = names.tp)) ans[i, ] <- as.numeric(unames %in%
+     names.tp[[i]])
> ans <- ans[, order(-colSums(ans))]
> ans <- ans[order(rowSums(ans)), ]
> ans[ans == 0] <- NA
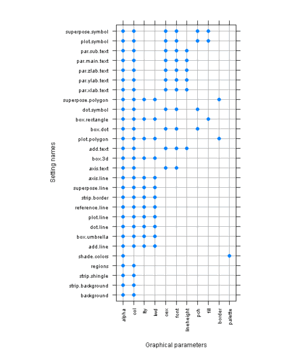
|
lattice
> pl <- levelplot(t(ans), colorkey = FALSE, scales = list(x = list(rot = 90)),
+     panel = function(x, y, z, ...) {
+         panel.abline(v = unique(as.numeric(x)), h = unique(as.numeric(y)),
+             col = "darkgrey")
+         panel.xyplot(x, y, pch = 16 * z, ...)
+     }, xlab = "Graphical parameters", ylab = "Setting names")
> print(pl)
|
ggplot2
> pg <- ggplot(subset(as.data.frame.table(ans), Freq ==
+     1), aes(Var2, Var1)) + geom_point() + xlab("Graphical parameters") +
+     ylab("Setting names") + opts(axis.text.x = theme_text(angle = 90,
+     hjust = 1, colour = "grey50"))
> print(pg)
|
Figure 7.4
lattice
> show.settings() |
ggplot2
The same not possible in ggplot2. |
No comments yet


